Spatial Analysis
The GIS Process
The GIS Process helps us to make sure we are taking each step that is needed to make sure we are providing good information to decision makers.
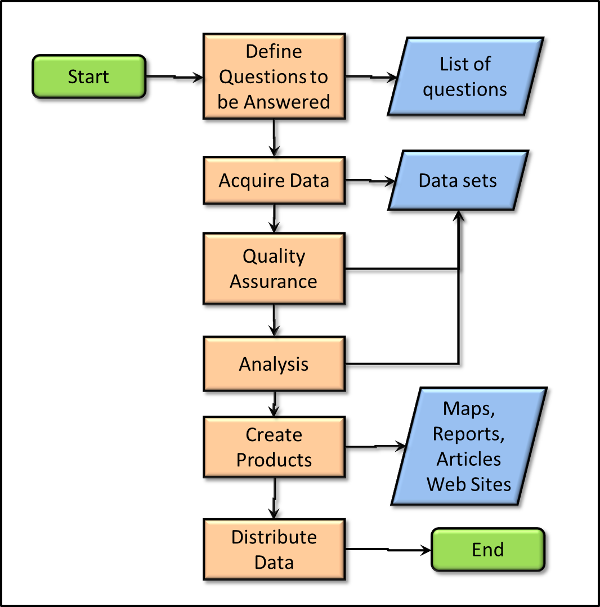
The critical elements of each step include:
- Define questions to be answered
- Make sure you talk with the client or sponsor and listen not only for what they tell you but also for hidden requirements they may not be aware of. Many projects move forward believing that they understand the clients needs and then have to start over when they find out the data they collected did not meet the requirements.
- Acquire data
- Acquiring the data is where most projects fail. Don't assume the data is available, check first. Also, be prepared to go into the field to at least check the quality of the data. In many cases we have to go into the field to collect additional data to answers the questions.
- Quality Assurance
- This is the step were you make sure the data meets the requirements to answer the questions. Make sure:
- The data is spatially referenced correctly (incorrect spatial references occur in about 20% of my projects and is the most common problem)
- The data is accurate and precise enough to meet the requirements
- The data is complete enough to meet the requirements
- The software tools you have can read the formats for the data
- The data files are not corrupted
- Analysis
- Analysis can be most fun and interesting part of GIS. Make sure you write down the steps you take in analysis as we almost always go back through the analysis several times to check our steps and make sure they are correct.
- Flow charts or simply a list of steps in MS-Word are great ways to document your analysis steps.
- Make sure to save the data you used as you may need to go back through the analysis again to update your results or for a new project.
- Create Products
- As a GIS professional it's up to you to make sure your products look professional and communicate information accurately and effectively.
- Use standard cartographic techniques and make sure your maps and charts are high resolution for reproduction on professional printing equipment
- Distribute Data
- It is becoming common that sponsors will require that we maintain our data indefinitely and host it on a web site to be available to everyone. Expect this trend to continue and make sure you have the facilities available either in house or from an organization that does this professionally.
- Also, make sure there are multiple backup copies of all your data for future use.
Data Flow
Flow charts like the one above and below are great tools to show just about anyone how our data and processes move from one step to another. The spatial analysis phase of the process consists largely of operations on existing layers that create new layers. Each layer represents a specific type of data. We usually perform operations on one or more layers which generates another, new, layer. The flow chart below shows a simple analysis task that was part of a project to identify the owners of land that bordered the Klamath River. This was a project completed by a GIS student and was used as part of a multi-state effort to restructure the water resources along the river.
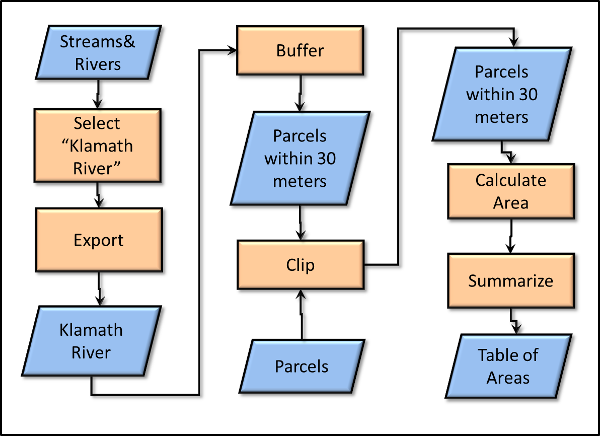
Note that the output from a spatial operation may be spatial (i.e. a new data layer is produced. Or the output may be aspatial (e.g., a single value, or a table).
Here is a YouTube video showing preparing data for analysis in ArcGIS Pro.
This YouTube video will show you how to do the analysis shown in the flow chart above in ArcGIS Pro.
Additional Resources
Next >